
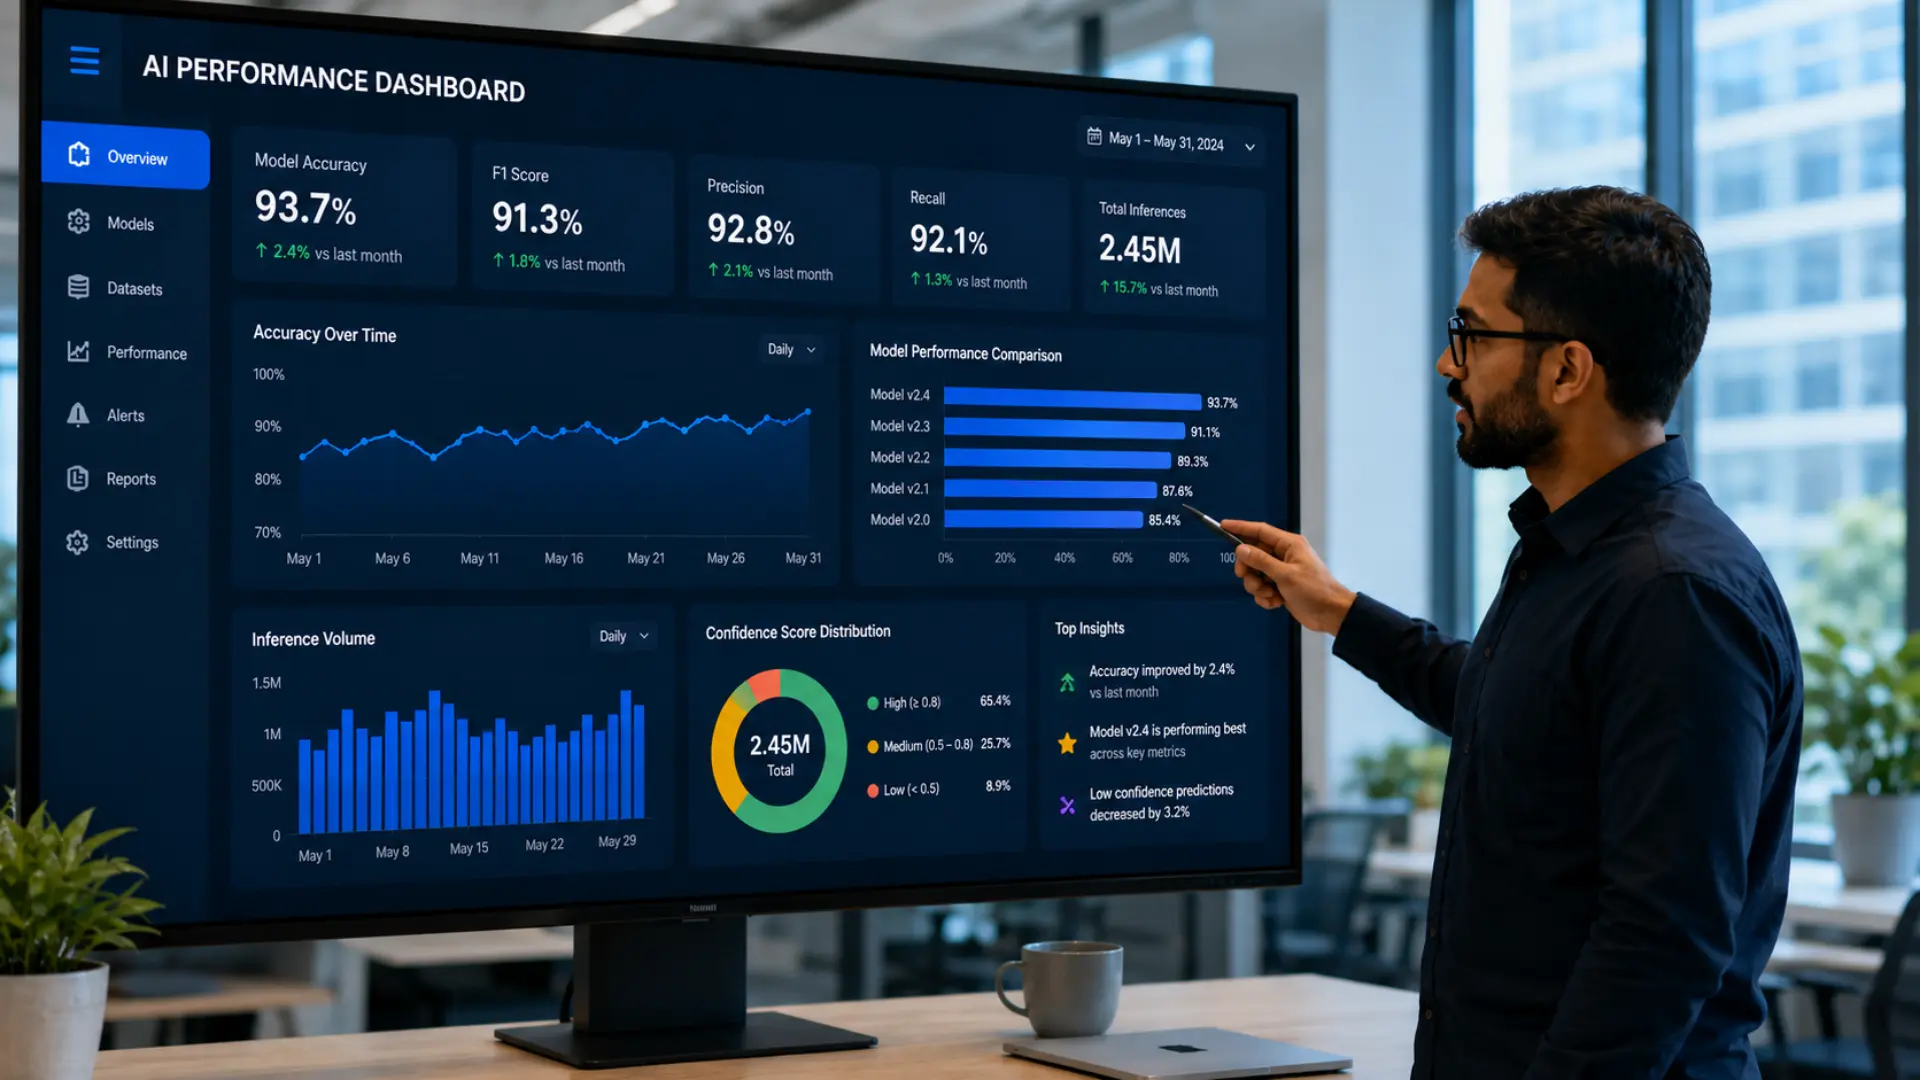
How to Measure AI Performance? The Right Way Without Drowning in Dashboards
Most companies that adopt AI never actually check whether it’s working. That’s not a guess; it’s a documented gap. A 2024 IBM study found that only 35% of enterprises track AI performance metrics, even though 80% say reliability of AI operations is their top concern. That disconnect is the reason so many AI projects quietly stall after the initial excitement fades.
If you’ve rolled out a chatbot, a coding assistant, a recommendation engine, or an internal copilot, you already know the feeling. Leadership asks, “Is this thing actually helping?” and the honest answer is often a shrug. This guide fixes that. How to measure AI performance? Across technical accuracy, business impact, user adoption, and safety, with the specific metrics, formulas, and benchmarks that separate a real measurement program from a vanity dashboard.
We’ll also answer a few related questions that come up constantly in AI conversations: Can AI read cursive handwriting? What AI detector do colleges use? These sound unrelated to enterprise AI metrics at first, but they’re really the same underlying question: how do we know if an AI system’s output can actually be trusted?
Why Measuring AI Performance Is Harder Than Measuring Software Performance
Traditional software either works or it doesn’t. A button either triggers the right function or it throws an error. AI is different because its output is probabilistic, not deterministic. The same prompt can produce slightly different answers each time, and “correct” often depends on context rather than a fixed rule.
That’s why a single metric never tells the full story. A model can be 95% accurate on a benchmark and still fail in production if the benchmark doesn’t reflect real user behavior. A chatbot can have flawless uptime and still frustrate customers if it gives technically correct but unhelpful answers.
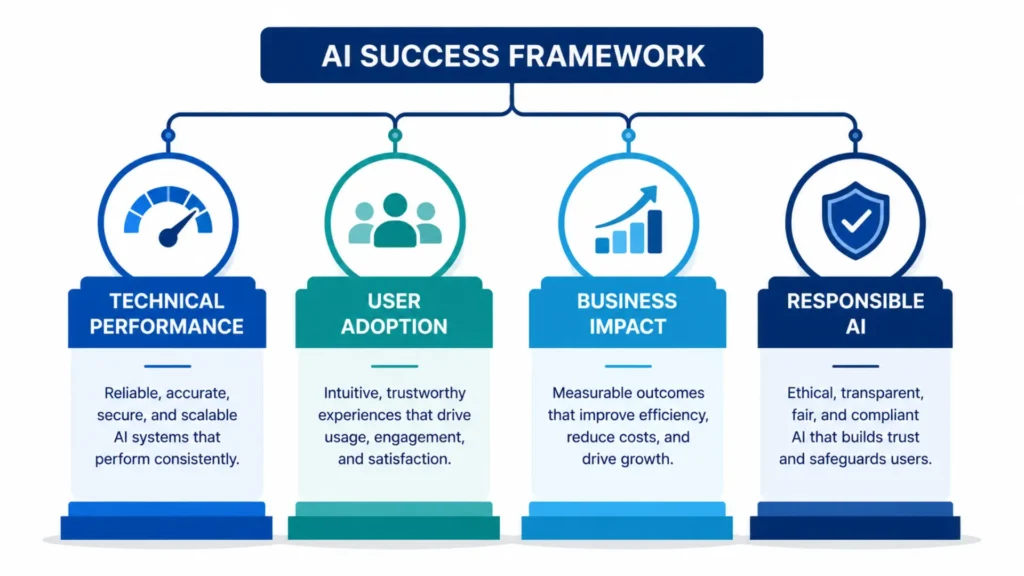
Measuring AI performance well means combining four different lenses:
- Model and technical performance: Is the AI accurate, fast, and stable?
- User experience and adoption: Are people actually using it, and do they trust it?
- Business impact: Is it saving money, generating revenue, or reducing risk?
- Responsible AI and safety: Is it fair, compliant, and free of harmful bias?
Skipping any one of these creates a blind spot. A model that’s fast and accurate but ignored by employees isn’t delivering value. A tool with high adoption but no measurable business outcome doesn’t justify its cost either.
Start With a Baseline, Not a Dashboard
Before you pick a single metric, document how the task got done before AI touched it. How long did it take a support agent to resolve a ticket? How many hours did a marketing team spend writing first drafts? What was the error rate on manual data entry?
Without this baseline, every AI metric floats in a vacuum. “Our AI resolves tickets in four minutes” means nothing until you know it used to take eleven. This step is constantly skipped, and it’s the single biggest reason AI ROI reports fall apart under scrutiny.
Layer 1: Technical and Model Performance Metrics
This is the layer data scientists and engineers care about most, and it’s the foundation everything else builds on.
Accuracy, Precision, and Recall
For classification tasks (fraud detection, spam filtering, medical triage flags), three numbers matter most:
- Accuracy: the percentage of predictions the model got right overall.
- Precision: of everything the model flagged as positive, how much was actually correct. High precision matters when false alarms are costly.
- Recall: of everything that was actually positive, how much the model caught. High recall matters when missing a case is dangerous, like a fraudulent transaction or a security threat.
These two often trade off against each other. A fraud model tuned for high recall will catch more fraud but will also mistakenly flag more legitimate transactions. The right balance depends entirely on what a false positive or false negative actually costs your business.
F1 Score
The F1 score combines precision and recall into one number, which is useful when you need a single figure to track over time or compare models. It’s a harmonic mean, so it penalizes models that do well on one metric but poorly on the other.
Latency and Response Time
Speed matters more than most teams initially assume. A model that’s technically brilliant but takes eight seconds to respond will get abandoned by users who expected near-instant answers. Track average response time and, more importantly, the 95th or 99th percentile latency, the slowest response a real user is likely to hit, not just the average.
Uptime and Reliability
If your AI system is customer-facing, uptime needs to be tracked the same way you’d track any production service. A model with 99.9% uptime still fails users for roughly nine hours a year. For anything mission-critical, that number needs scrutiny.
Real-World, Task-Based Benchmarks
Academic benchmarks like exam-style question sets have historically been the go-to way to compare AI models, but they don’t tell you much about how a model performs on actual work. OpenAI’s GDPval benchmark was built to close that gap. It evaluates AI model capabilities on real-world, economically valuable knowledge-work tasks, covering the majority of Department of Labor work activities across 44 occupations in the nine sectors that contribute most to U.S. GDP.
The tasks are built from the work of industry professionals with an average of 14 years of experience, and unlike synthetic academic-style tests, GDPval tasks are based on deliverables that either already exist as real work products or are constructed to closely resemble them. That includes spreadsheets, slide decks, legal memos, and diagrams, the actual output formats knowledge workers produce every day.
This matters for anyone building an AI measurement framework because it signals a broader shift in the industry: measuring AI success is moving away from “did it pass a quiz” and toward “did it produce something a professional would actually accept.”
Layer 2: User Experience and Adoption Metrics
A high-performing model that nobody uses has an effective business value of zero. This is the layer most technical teams underweight.
Adoption Rate
What percentage of your target users have actually tried the AI tool at least once? Mature enterprise AI programs typically target 70 to 85 percent active user rates, though early-stage deployments should be judged on their trajectory toward that number rather than measured against it immediately.
Usage Frequency and Depth
Adoption alone can be misleading. Weekly active users are a stronger signal of genuine value than monthly users, and a decline in usage frequency among previously active users is an early warning sign worth investigating. Also track feature depth: whether people are using multiple capabilities deeply or just skimming the surface of one feature repeatedly, since those are very different adoption patterns.
User Satisfaction
Simple surveys (CSAT, thumbs up/down on individual responses, or a Net Promoter Score for the tool itself) tell you whether people actually like working with the AI, separate from whether they’re technically “using” it. Low satisfaction paired with high usage often means people feel forced to use a tool they don’t trust, a pattern worth catching early.
Task Completion Rate
For AI agents and copilots specifically, measure how often a user’s task actually gets resolved without needing to escalate to a human or start over manually. Whether evaluating workflow management tools like GC AI or internal support bots, tracking completed processes is often far more revealing than accuracy scores alone because it captures the full end-to-end experience.
Example: A legal team rolls out an AI contract-review assistant. The model achieves 92% accuracy in flagging risky clauses during testing. But six weeks in, only 20% of lawyers are opening it more than once. The technical metric looks great; the adoption metric tells the real story: something about the workflow, trust, or interface is broken, and that’s what needs fixing next.
Layer 3: Business Impact and ROI Metrics
This is the layer that determines whether a CFO renews the budget next year.
Return on AI Investment (ROAI)
Per IBM research, best-in-class companies see roughly 13% ROI on AI projects, compared to an average of 5.9% across enterprises, a wide gap that usually comes down to whether a company actually measures and iterates or deploys and hopes.
According to the Wharton School’s 2025 report on generative AI adoption in the enterprise, 75% of organizations report positive ROI from AI, which is encouraging, but it also means a full quarter of deployments are not paying for themselves.
Cost Savings and Efficiency Gains
Some enterprise AI initiatives have delivered productivity gains ranging from 26% to 55% in reported cases, with an average return of roughly $3.70 for every dollar invested. Track this by comparing labor hours, error-correction costs, and cycle time before and after AI adoption, always against the baseline you documented at the start.
Revenue Contribution
For customer-facing AI (personalization engines, sales copilots, AI-driven recommendations), tie usage directly to revenue where possible. This could be due to a lift in conversion rate, an increase in average order value, or reduced churn within AI-assisted customer segments.
Cost Per Outcome, Not Just Cost Per Query
Simple per-inference cost tracking works fine for straightforward generative AI use cases. But for agentic AI systems, a single completed process can involve multiple model calls, tool invocations, retry loops, and human oversight steps, so a workflow-level cost model is needed instead of a flat per-inference number, or the true cost per completed process gets understated.
CFOs increasingly expect this level of rigor. Finance leaders are now looking for AI ROI reporting across five dimensions: time saved, cost reduction, quality improvement, revenue impact, and risk reduction, and single-metric reports that only cover cost savings are routinely rejected at the board level.
Layer 4: Responsible AI and Risk Metrics
This layer is skipped most often and is the most likely to cause a public incident if ignored.
- Bias and fairness audits. Test whether outputs differ meaningfully across demographic groups for the same input.
- Hallucination rate. How often does the model state something false with confidence? This matters enormously for anything customer-facing or medical.
- Data privacy compliance. Are inputs and outputs being logged, stored, and used in ways that comply with regulations like the CCPA or, for regulated industries, HIPAA?
- Human override rate. How often do humans have to step in and correct or reverse an AI decision? A rising override rate is often the earliest sign that a model has drifted from its training distribution.
A Practical Framework: The 6-8 Metric Scorecard
Tracking dozens of metrics creates noise, not clarity. A commonly recommended approach is to keep your core dashboard to six to eight metrics total, enough to cover all four layers without overwhelming decision-makers, and consistent enough that engineering, operations, and leadership are all looking at the same numbers instead of arguing over separate dashboards with different definitions.
A reasonable starting scorecard for most teams:
- Accuracy or F1 score (technical)
- 95th percentile latency (technical)
- Weekly active users (adoption)
- User satisfaction score (adoption)
- Cost per completed task (business)
- ROI or cost savings vs. baseline (business)
- Hallucination or error escalation rate (responsible AI)
Add or swap metrics based on your specific use case, but resist the urge to track everything just because it’s available.
Common Mistakes When Measuring AI Performance
Measuring the model, not the outcome. A 98% accurate model that solves the wrong problem is still a failure. Always tie technical metrics back to a business or user outcome.
Skipping the baseline. Without a “before AI” number, every improvement claim is unverifiable.
Treating adoption as binary. “People are using it” isn’t a metric. Frequency, depth, and satisfaction matter far more than a simple yes/no.
Ignoring cost accounting for agentic workflows. Retry loops, tool calls, and human oversight time all add real cost that a flat per-query number will miss entirely.
Reporting only cost savings to leadership. As noted above, boards increasingly expect a fuller picture across time saved, quality, revenue, and risk, not just a single favorable number.
No kill criteria. Programs that continue purely on momentum, without predefined thresholds for scaling back or shutting down an underperforming AI initiative, tend to underdeliver against their original business case.
How This Connects to Everyday AI Questions
The same “can we trust this output” logic behind enterprise AI metrics shows up in smaller, more personal questions people ask about AI capability. Here are three that come up often.
Can AI Read Cursive?
Yes, and modern systems are considerably better at it than most people assume. Deep learning models built for handwritten text recognition, particularly those using vision transformers, analyze entire words and sentences at once rather than isolated letters, which helps with the connected strokes that make cursive hard to parse. On clean, legible cursive, specialized tools can achieve 95-99% character accuracy, though results drop noticeably with messy handwriting, faded ink, or historical scripts. The practical takeaway mirrors the enterprise lesson above: never trust an AI transcription blindly for anything important; treat it as a fast first pass that still needs human review, especially for names, dates, and signatures.
What AI Detector Do Colleges Use?
Turnitin is the dominant tool, licensed to more than 16,000 institutions and roughly 71 million students, largely because it’s already bundled into learning management systems like Canvas, Blackboard, and Moodle that schools were already paying for. Beyond Turnitin, GPTZero, Copyleaks, Originality.ai, and Pangram Labs compete as standalone detectors, while tools like Grammarly Authorship track how a document was actually written rather than just scoring the finished text.
It’s worth knowing these tools are far from foolproof. A 2023 Stanford study found that detectors falsely flagged 61.3% of essays written by non-native English speakers as AI-generated, and several major universities, including Vanderbilt and Georgetown, have disabled AI detection features entirely over accuracy and transparency concerns. That’s a real-world example of exactly why the “responsible AI” layer discussed earlier, which tests for bias and unfair outcomes, isn’t optional. A detector with a high false-positive rate against a specific group is a fairness failure, not just a technical inconvenience.
Frequently Asked Questions
How often should we measure AI performance?
Technical metrics like latency and error rate should be monitored continuously, ideally in real time. Adoption and satisfaction metrics are usually reviewed weekly or monthly. Business ROI is typically reported quarterly, aligned with standard financial reporting cycles.
What’s the difference between AI performance metrics and AI KPIs?
Performance metrics measure how the system behaves technically: accuracy, speed, and reliability. KPIs connect those metrics to business goals set by leadership, like revenue growth or cost reduction tied to AI initiatives.
Do small businesses need the same measurement framework as large enterprises? The four-layer structure still applies, but small teams can start with a much smaller scorecard, often just three or four metrics, and expand as the AI program matures.
What tools help track AI performance?
Options range from built-in analytics in platforms like Google Cloud’s Vertex AI and Microsoft’s Azure AI, to specialized observability tools, to simple internal dashboards built from usage logs and survey data. The right choice depends on scale and technical resources, not on chasing the most feature-rich option available.
Is a high accuracy score enough to call an AI project successful?
No. Accuracy is necessary but not sufficient. A model can be highly accurate in testing and still fail in production due to low adoption, poor user trust, or a mismatch between its test data and how people actually use it day-to-day.
Conclusion
Measuring AI performance isn’t about picking one impressive-sounding number for a slide deck. It’s about building a repeatable system across four layers: technical performance, user adoption, business impact, and responsible AI, and checking all four regularly, not just the one that happens to look good this quarter.
Start with a real baseline. Keep your core scorecard small enough that people actually look at it. Tie every technical metric back to an outcome a human being cares about. And remember that even the most advanced AI models have limits: they can transcribe cursive with impressive accuracy and produce work that rivals human professionals on realistic tasks, and they still make mistakes that deserve human oversight. Measuring performance honestly across all four layers is what separates AI programs that deliver real value from those that look busy.
For readers who want to go deeper into how large-scale AI evaluation is evolving, the Wikipedia entry on AI benchmarks offers useful historical context on how technical benchmarking practices developed before generative AI made outcome-based measurement necessary.